Viewing Values of Variables
When in Debug Mode, you can go to Code View to inspect values and states of objects and variables. You can use breakpoints to temporary suspend your program from running so you can examine your code. Visual Studio and Visual C# Express offers tools that allows you to see how the program runs. Create a new Console Application and name it DebuggingTechniques. Use the following code.
using System;

namespace DebuggingTechniques
{

    public class Person
    {
        public string Firstone { get; set; }
        public string Lastone { get; set; }
        public int Age { get; set; }

        public Person() : this("", "", 0) { }

        public Person(string fn, string ln, int a)
        {
            Firstone = fn;
            Lastone = ln;
            Age = a;
        }
    }

    public class Program
    {
        static void Main()
        {
            Person firstPerson =  new Person ("John", "Smith", 20);
            Person secondPerson = new Person();
            string firstName;
            string lastName;
            int age;

            firstName = "Mike";
            lastName = "Welsh";
            age = 30;

            secondPerson.Firstone = firstname;
            secondPerson.Lastone = lastName;
            secondPerson.Age = age;

            Console.WriteLine("First Person Details: ");
            Console.WriteLine("First Name: {0}", firstPerson.Firstone);
            Console.WriteLine("Last Name: {0}", firstPerson.Lastone);
            Console.WriteLine("Age: {0}
", firstPerson.Age);

            Console.WriteLine("Second Person Details: ");
            Console.WriteLine("First Name: {0}", secondPerson.Firstone);
            Console.WriteLine("Last Name: {0}", secondPerson.Lastone);
            Console.WriteLine("Age: {0}", secondPerson.Age);
        }
    }
}
Example 1 – Code for Viewing Variables Demonstration
Add a breakpoint to the first line of code of the Main method. We will now demonstrate how we can monitor the values of variables and objects. Run the program in Debug Mode. The execution will stop at the first breakpoint. The Quick Info window will show up containing the name of the variable and its current value.
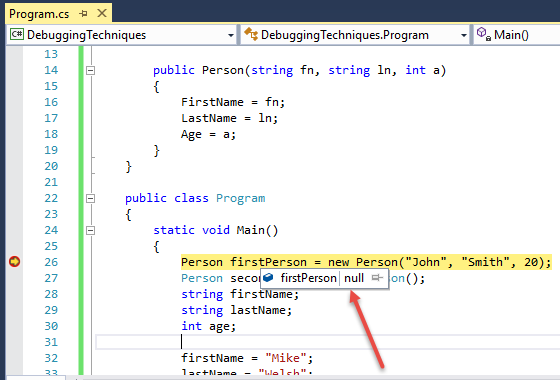
The current value of firstPerson object is null, since no value has been assigned to it yet. The current line is not yet executed. You can see a familiar pin icon. Clicking this icon will pin the Quick Info window so it will not auto-hide when you release your mouse. To unpin it, put the mouse over the pinned Quick Info window and press the pin icon again or the close button.
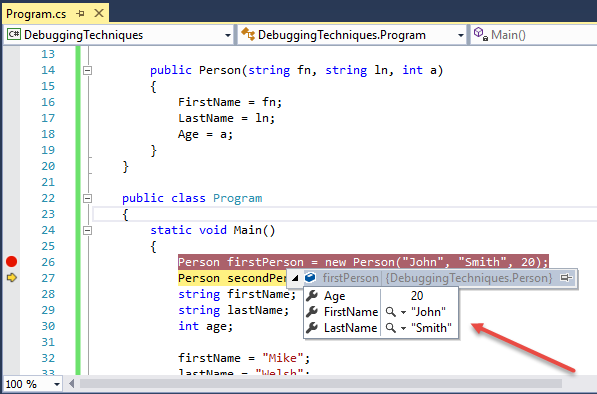
Use the Step Over command to execute the current code and move to the next line of code. Since the previous line of code has been executed, firstPerson now has been initialized with values thanks to its constructor. If you hover again to the firstPerson object, you will now be presented with the DataTip window. You will notice that it doesn’t contain null as a value but the full name of its class. You will also notice a + icon at its left side, clicking this will show all the properties and fields(if any) of the current object together with their respective values.
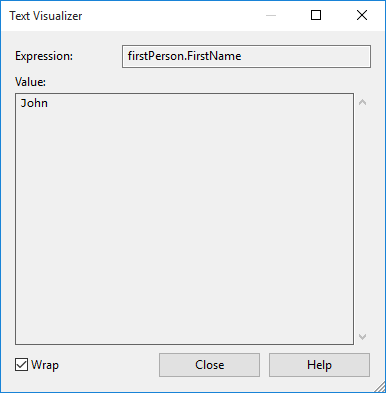
You might also notice the magnifying glass icon on some members. Clicking this will bring the Text Visualizer window which shows you the full content of the variable in case it is too large.
If you click the values in the DataTip window, you can edit them. For example, click on the value of the Firstone field and change the value from “John” to “Joseph” then press enter.
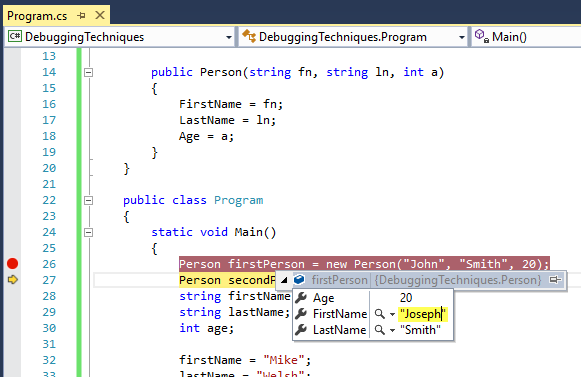
Note that this editing capability can also be done in the Quick Info window.
The Locals Window
The Locals Window is a central location where you can view all the values of variables and objects currently in use by the program. The Locals Window is automatically shown when you run the program in Debug Mode. It is located at the lower left portion of the IDE. Press Step Over until you reach the first WriteLine statement. Now look at the Locals Window
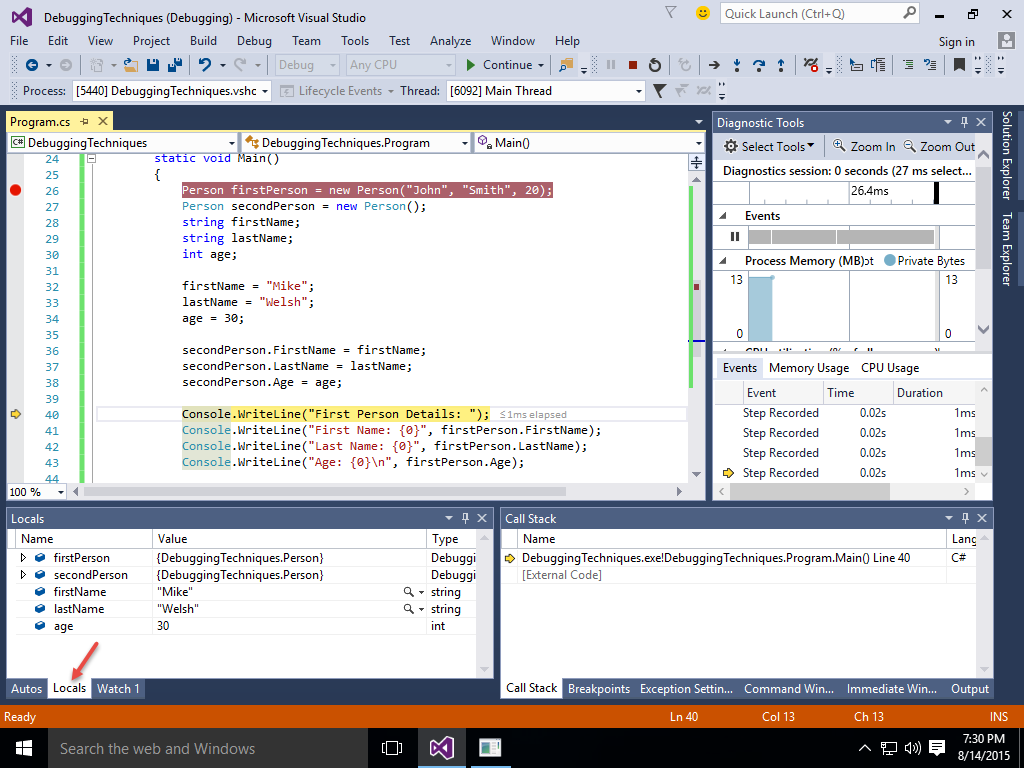
You will see a list of all the variables currently in use. The columns consist of the Name, Value and Type. For complex types such as classes, you will see a + icon at the left side of the name, clicking those will show the members of the class together with their values. You can also modify the values of the variables by double clicking the values in the Locals Window.
The Watch Window
The Watch Window allows you to type a name of the variable and view its current value. You can even do arithmetic expressions with the variable such as finding the resulting value when another value is added to the variable. The Watch Window can be accessed(by default) as a tab where the Locals Window is located.
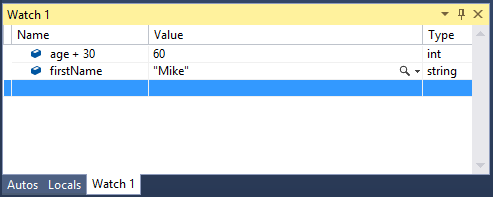
You can type the name of the variable at the Name column. Once the enter key is pressed, the value of the variable will show up in the Value column. You can also try out arithmetic expressions such as adding a constant value or another variable inside the Name column so you can test the value of a variable after the modification.